Code Confidence technical note 0005 - Launching a GDB server as an Eclipse External Tool
This technical note describes procedure for the launching of a GDB server from the Eclipse workbench using an External Tool configuration. The ST-LINK GDB server provided with STM32CubeIDE is used in this illustration, but the procedure may be adapted for many other GDB servers that are implemented as command-line tools.
When developing code for a deeply embedded target, it is common practice to build the code on a desktop computer (the host) and download the resulting image to the embedded device (the target) for execution. Developers working with an Eclipse-based development environment (IDE) will typically download and control execution of their code by launching a debug session using plugins provided by the Eclipse C/C++ Development Tooling project (CDT). The debug session is initiated by launching the GDB debugger and instructing it to connect to the remote target via a GDB server. The GDB server may be implemented within a hardware debugger on the local area network, or, more commonly, as a separate command-line tool running alongside GDB on the host. The launching of the GDB server may be managed automatically by some IDEs, but advanced usage may require greater control over the launch sequence. In such cases, developers may create an External Tool configuration within Eclipse to launch the GDB server.
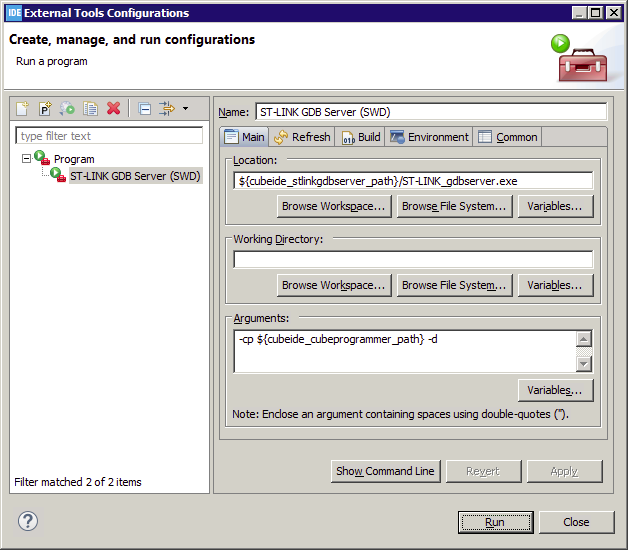
Creation of an External Tool configuration is achieved from the External Tools Configurations dialog
which is opened from the Eclipse workbench using the
Run > External Tools > External Tools Configurations... menu item.
Double-click on the Program item within the tree on the left side of the dialog to create a new configuration.
On the right side of the dialog, provide a meaningful name for the external tool. In this example, we use
the name ST-LINK GDB Server (SWD) since we will be launching the GDB server for use with a Serial Wire Debug (SWD) port
on the target device.
On the Main page of the dialog, in the Location field, provide the full path to the GDB server executable file. You can type the location directly
or navigate to the file using the Browse File System... button. However, some IDEs provide Eclipse variables representing
the absolute paths of certain integrated tools and it is recommended to use an appropriate variable, where available, to make
the configuration more readable and more portable. In this example, we use the Variables... button and observe that STM32CubeIDE
provides a variable named cubeide_stlinkgdbserver_path
which is described as "Path to the internal STLink GDB Server". We can use this variable to provide the path and then append the
name of the executable file to the resulting token to complete the location.
In the Working Directory field, specify the directory from which the GDB server should be invoked. This may be
necessary if the GDB server expects to find certain data files at locations relative to the current working directory. In this example,
the working directory is not significant and we can leave the Working Directory field empty.
In the Arguments field, specify the arguments which must be passed to the GDB server to configure it for the intended
usage. The necessary arguments will be highly specific to the GDB server implementation and the developer should consult documentation for
guidance. Some GDB servers may offer a usage message when invoked with no arguments, so it can be informative to leave this field empty
and observe output when the GDB server is launched. In this example, we must provide the location of the STM32CubeProgrammer tool
using the -cp argument and configure the ST-LINK GDB server for use with Serial Wire Debug hardware using the -d
argument. We take advantage of the cubeide_cubeprogrammer_path variable provided by STM32CubeIDE for convenience in
specifying the necessary path:

Some GDB servers may be configured to either terminate on conclusion of a debug session or to remain active for the next debug session.
In this example, we have opted to allow the ST-LINK GDB server to terminate by omitting to specify the -e argument.
The other pages of the dialog allow more specialized configuration of the external tool and are typically unused when configuring a GDB server with the exception of the Build before launch option on the Build page. In most scenarios, it is not necessary to build before launch of the GDB server because CDT will perform a check that the project build is up to date before launching GDB. The Build before launch option can therefore be disabled.
Following creation of an external tool configuration for a GDB server, the server may be invoked at any time by selecting the configuration within the External Tools Configurations dialog and clicking Run, or, more commonly, by selecting the external tool configuration from the list of most recently used external tools. Any messages emitted by the GDB server will be observable within an Eclipse Console view which is created when the tool is launched.
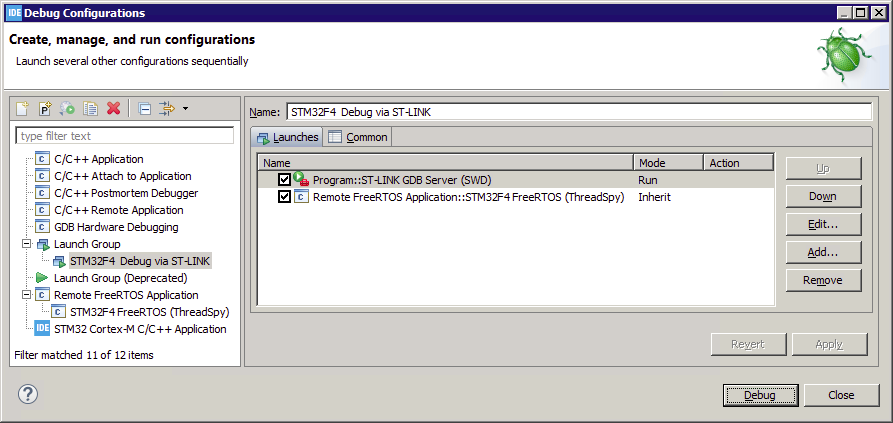
In typical usage, a CDT debug session must be launched immediately following launch of the external tool and the GDB process created by the CDT debug session will then connect to the GDB server process created by the external tool session. For convenience, the two launches may be triggered in the correct sequence by creating an Eclipse Launch Group configuration. The launch group configuration should be created from the Eclipse Debug Configurations dialog and should list the two launches in the correct launch order as shown in the following STM32F4 Debug via ST-LINK launch group configuration:

Note that the external tool configuration used to launch the GDB server supports the "Run" launch mode only. It is therefore necessary to override the default launch mode for this launch configuration within the launch group. Following creation of the launch group configuration, a debug session involving both the GDB server and the CDT launch may be invoked at any time by selecting the configuration within the Debug Configurations dialog and clicking Debug, or, more commonly, by selecting the launch group configuration from the list of most recently used debug launches:

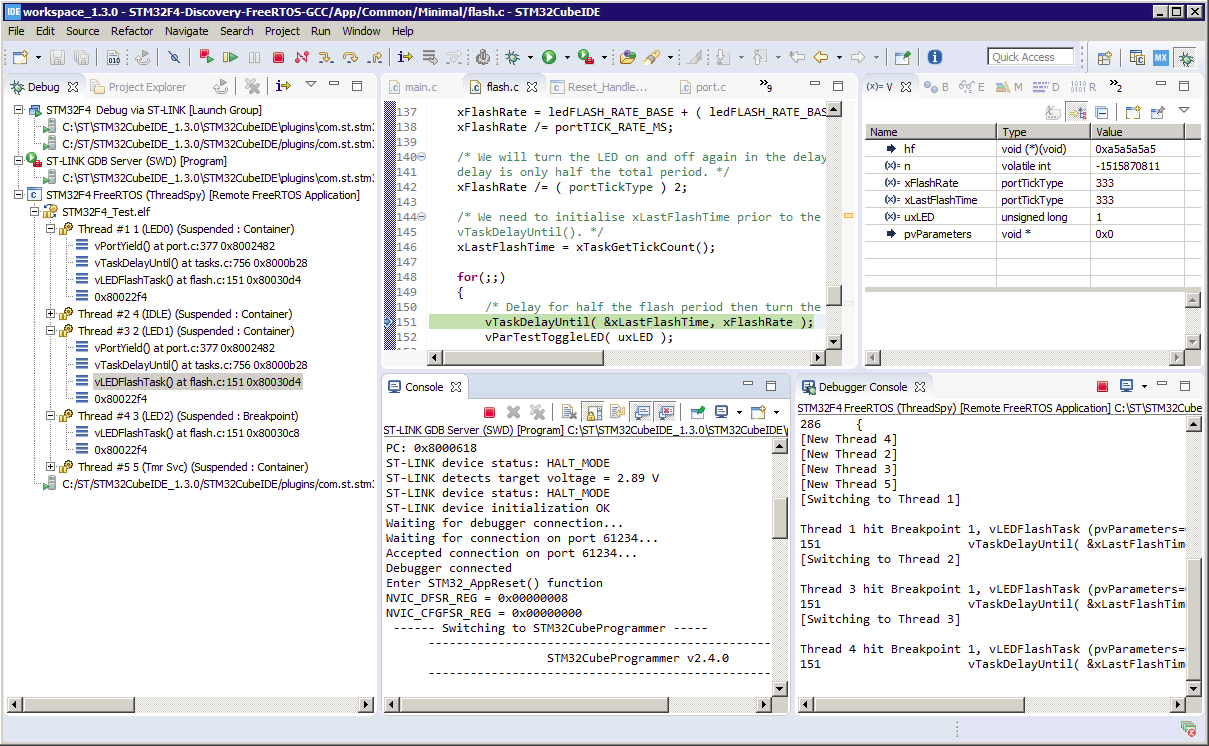
Note that the STM32F4 Debug via ST-LINK launch group session and the individual launches described by the group are presented within the Debug view of the workbench following launch. The Remote FreeRTOS Application launch within this example launch group is used to provide task-aware debugging of a FreeRTOS application using Code Confidence ThreadSpy technology. Back…


